The fuel consumption rate on the EPA electric vehicle label states how many kilowatt-hours (kWh) the vehicle would use to travel 100 miles, a rate of consumption that relates directly to the amount of electricity used and to cost.
EV battery charging efficiency varies, but it is often 84% to 93%, based on published studies (Chae et al., 2011; Gautam et al., 2011) and data from the Idaho National Laboratory Advanced Vehicles website.
Drivers building a route itinerary can pair these energy and fee calculations with our EV road trip planning guide before selecting highway charging stops. The reference table below summarizes the primary consumption, weather, billing, and regulatory variables that govern long-distance charging budgets.
| Cost Calculator Variable | Verified Benchmark and Operational Rule |
|---|---|
| Label Consumption Rate | The fuel consumption rate on the EPA electric vehicle label states how many kilowatt-hours (kWh) the vehicle would use to travel 100 miles, a rate of consumption that relates directly to the amount of electricity used and to cost. |
| Planner Trip Equations | Clean Energy Calculator's EV Road Trip Cost Planner calculates Usable Range = Battery kWh × Efficiency (mi/kWh) × (80% max − 10% min) = Battery × Efficiency × 0.70, First Leg = Battery kWh × Efficiency × (Starting Charge% − 10% minimum), Total kWh = Trip Distance ÷ Efficiency, and Total Cost = Total kWh × Charging Rate ($/kWh), assuming 65 mph highway speed and 30 minutes per DC fast-charge stop to 80%. |
| Charger-to-Battery Efficiency | EV battery charging efficiency varies, but it is often 84% to 93%, based on published studies (Chae et al., 2011; Gautam et al., 2011) and data from the Idaho National Laboratory Advanced Vehicles website. |
| Cold-Weather Cabin Heating Impact | For electric vehicles (EVs) at 20°F, fuel economy can drop roughly 39% in mixed city and highway driving and driving range can drop by 41%, with about two-thirds of the extra energy consumed used to heat the cabin. |
| Public Station Billing Models | Common public EV charging pricing structures include billing by kWh, by session, by length of time, or through a subscription; session- and time-based structures are common in states where non-utilities are prohibited from selling electricity, and more than 20% of public charging (including Level 1, Level 2, and DC fast chargers) is free to use. |
| Card Pre-Authorization vs. Account Billing | Electrify America places a $50 temporary pre-authorization hold on walk-up credit and debit card sessions to verify the card before dispensing electricity (releasing the difference between $50 and the final charging total after the session ends), whereas account holders with a saved payment method are billed in $20 increments. |
How an EV Road Trip Calculator Converts Distance and Consumption into Grid Energy
An accurate ev road trip cost calculator begins by aligning your vehicle’s displayed consumption unit with the formula used to project grid electricity draw.
- On the EPA and DOE fuel economy label, combined fuel economy is a weighted average of City and Highway values calculated by weighting the City value by 55% and the Highway value by 45%, and some form of the miles per gallon metric has appeared on vehicle labels since 1977.
- For vehicles that do not use liquid fuels—such as electric vehicles, plug-in hybrid electric vehicles operating on electricity, and compressed natural gas vehicles—the EPA label displays miles per gallon of gasoline-equivalent (MPGe), representing the number of miles the vehicle can travel using a quantity of fuel with the same energy content as a gallon of gasoline.
- The fuel consumption rate on the EPA electric vehicle label states how many kilowatt-hours (kWh) the vehicle would use to travel 100 miles, a rate of consumption that relates directly to the amount of electricity used and to cost.
- Over 1,000 miles, the fuel savings for a vehicle that gets 10 MPG versus 15 MPG is about 33 gallons, whereas the same 5 MPG jump from 30 MPG to 35 MPG saves only about 5 gallons; this non-linear ‘MPG illusion’ shows why a fuel consumption rate per 100 miles allows more accurate energy usage comparisons.
- On the EPA electric vehicle label, the driving range represents the approximate number of miles a fully charged vehicle can travel in combined city and highway driving before recharging, and the displayed charge time is based on charging a fully empty battery using 240 volt service rather than a standard 120 volts household outlet.
- The DOE AFDC Vehicle Cost Calculator requires separate city and highway electricity efficiency inputs in KWh/100 miles along with electricity range in miles, average daily driving distance, percent highway driving, and state electricity price.
- Clean Energy Calculator’s EV Road Trip Cost Planner calculates Usable Range = Battery kWh × Efficiency (mi/kWh) × (80% max − 10% min) = Battery × Efficiency × 0.70, First Leg = Battery kWh × Efficiency × (Starting Charge% − 10% minimum), Total kWh = Trip Distance ÷ Efficiency, and Total Cost = Total kWh × Charging Rate ($/kWh), assuming 65 mph highway speed and 30 minutes per DC fast-charge stop to 80%.
Once you check whether your dashboard displays consumption or distance per unit of energy, apply the base distance calculation and adjust for charging and drivetrain losses between the pedestal and the wheels:
- All-electric vehicles (EVs) convert over 77% of the electrical energy from the grid to power at the wheels, whereas conventional gasoline vehicles only convert about 12%–30% of the energy stored in gasoline to power at the wheels.
- Most all-electric vehicles can travel more than 100 miles on a charge and some can travel in excess of 200 or 400 miles depending on the model; fully recharging the battery pack can take 3 to 12 hours, and even a fast charge to 80% capacity can take 30 min.
- A Department of Energy study suggests that EV batteries may last 12 to 15 years in moderate climates and 8 to 12 years in severe climates.
- In Oak Ridge National Laboratory (ORNL) EV energy-use estimates, electric motor efficiency—including inverter and gear reduction losses—is assumed to be 76.4%–80.2% based on Miller et al. (SAE 2011-01-0887) and adjusted downward by 4% for parasitic losses.
- EV battery charging efficiency varies, but it is often 84% to 93%, based on published studies (Chae et al., 2011; Gautam et al., 2011) and data from the Idaho National Laboratory Advanced Vehicles website.
Highway Derating Factors: Cold Weather, Air Conditioning, Speed, Cargo, and Payload
Window-sticker figures reflect combined drive cycles rather than continuous interstate speeds under weather and cargo loads.
Ambient temperature and cabin climate control settings create some of the largest swings in highway energy draw:
- Fuel economy tests show that in city driving, a conventional gasoline car’s gas mileage is roughly 15% lower at 20°F than at 77°F (and can drop as much as 24% for short 3- to 4-mile trips), while hybrid fuel economy can drop about 30% to 34% under these conditions.
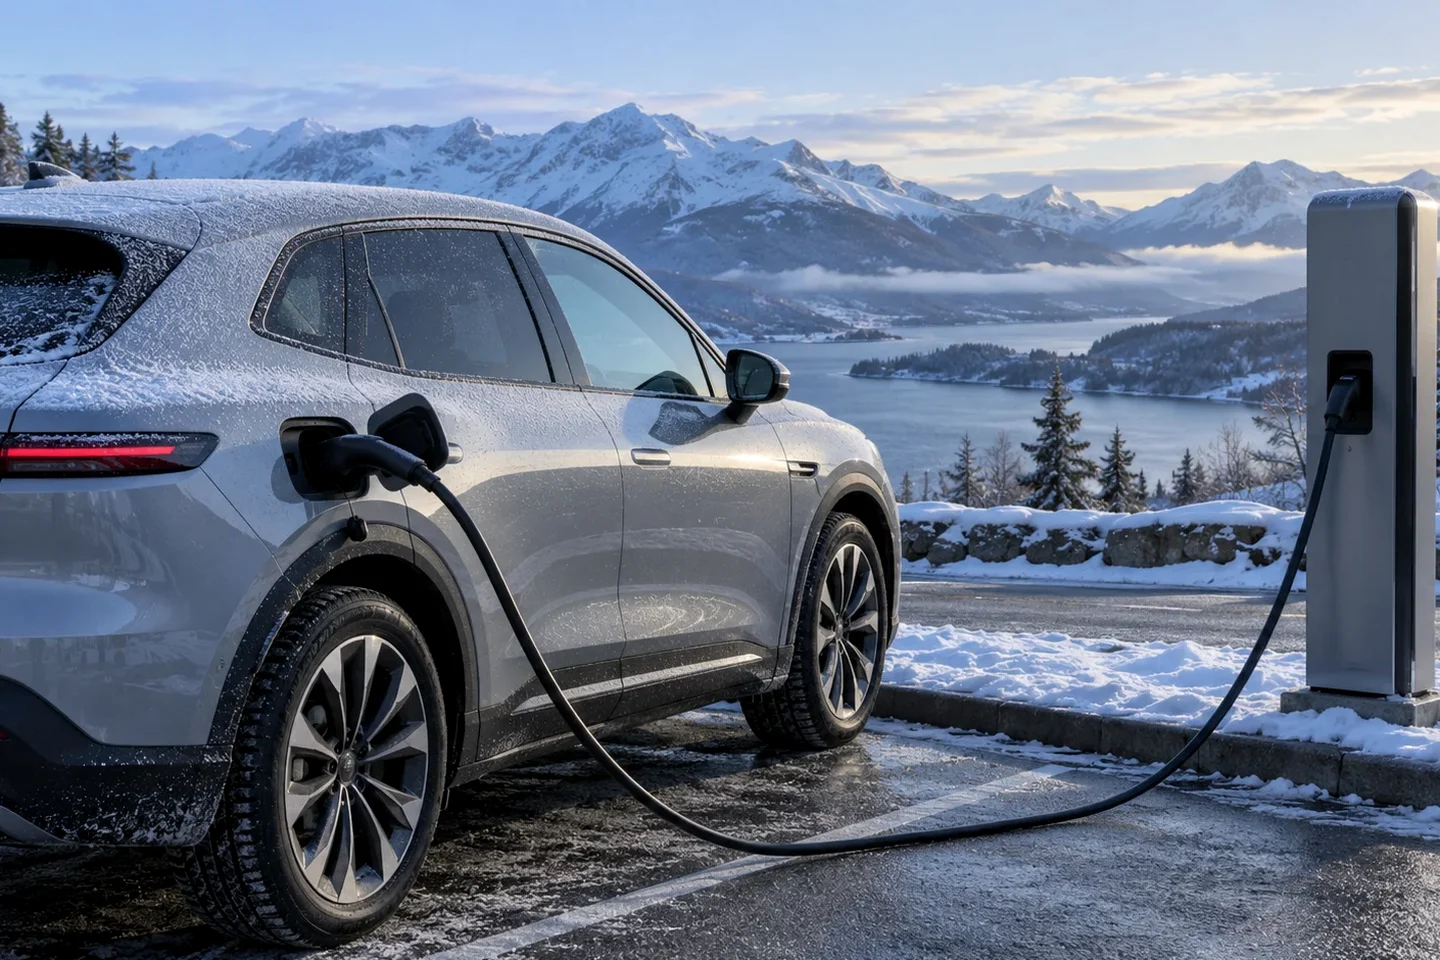
- For electric vehicles (EVs) at 20°F, fuel economy can drop roughly 39% in mixed city and highway driving and driving range can drop by 41%, with about two-thirds of the extra energy consumed used to heat the cabin.
- Based on a 2019 study by AAA, when the cabin heater is not used, EV fuel economy is 8% lower at 20°F than at 75°F, and driving range is about 12% lower.
- In cold weather, colder air is denser (increasing aerodynamic drag, especially at highway speeds), tire pressure decreases (increasing rolling resistance), and battery and regenerative braking performance decrease; preheating an EV cabin while plugged into the charger and using seat warmers instead of the cabin heater can save energy and extend range.
- Under very hot conditions, air conditioning (AC) use can reduce a conventional vehicle’s fuel economy by more than 25% (particularly on short trips), and the AC’s effect on hybrids, plug-in hybrids, and electric vehicles (EVs) can be even larger on a percentage basis.
- Driving with windows open increases aerodynamic drag (wind resistance)—an effect that is small at low speeds but increases at highway speeds—so drivers should roll windows down at lower speeds, use the AC at highway speeds, and pre-cool plug-in hybrids and EVs while plugged into the charger.
Speed, exterior cargo carriers, braking habits, and vehicle payload also change the energy required per highway leg:
- Aggressive driving (speeding, rapid acceleration and braking) can lower gas mileage by roughly 15% to 30% at highway speeds and 10% to 40% in stop-and-go traffic, while driver feedback devices can help the average driver improve fuel economy by about 3% and those using them to save fuel by about 10%.
- Gas mileage usually decreases rapidly at speeds above 50 mph (each 5 mph driven over 50 mph is like paying an additional $0.30 per gallon for gas, with a 7%–14% fuel economy benefit from slowing down 5 to 10 mph at $4.28 per gallon), and the long-trip cost formula per 100 miles is Cost per 100 Miles = Fuel Price ÷ Estimated MPG × 100.
- In the ORNL highway speed-mpg study (SAE 2013-01-1113), dynamometer tests covered 74 light-duty vehicles (engine sizes 1.5 L to 6.2 L, model years 2003 to 2012, with no plug-in hybrids or electric vehicles tested), so the exact applicability of those gasoline speed curves to plug-in hybrids and electric vehicles is unknown.
- Based on ORNL testing (SAE 2014-01-1614) using a 20“ H x 40“ W x 50“ L roof-top cargo box, a large blunt roof-top cargo box can reduce fuel economy by around 2% to 8% in city driving, 6% to 17% on the highway, and 10% to 25% at Interstate speeds (65 mph to 75 mph), whereas rear-mount cargo boxes or trays reduce fuel economy by 1% or 2% in city driving and 1% to 5% on the highway.
- An extra 100 pounds of cargo weight in a vehicle could reduce fuel economy by about 1%, based on a 0.33% fuel economy improvement per 1% weight reduction estimated by Ricardo Inc. (April 2008) assuming a 3,200 lbs vehicle weight.
- EVs and hybrids vary significantly in design and energy management (so tips for one model may not apply to another); gentle or moderate braking allows regenerative braking to recover energy and store it as electricity whereas hard braking uses conventional friction brakes that do not recover energy, and heating, air conditioning, and entertainment systems can have a greater effect on hybrids and electrics.
Drivers comparing drivetrain behavior across elevation changes can also review our breakdown of hybrid vehicles in highway and mountain driving. The table below summarizes the verified highway efficiency adjustments to apply in an ev road trip calculator.
| Operating Condition | Measured Consumption and Efficiency Effect |
|---|---|
| Cold Weather (With Cabin Heat) | For electric vehicles (EVs) at 20°F, fuel economy can drop roughly 39% in mixed city and highway driving and driving range can drop by 41%, with about two-thirds of the extra energy consumed used to heat the cabin. |
| Cold Weather (Without Cabin Heat) | Based on a 2019 study by AAA, when the cabin heater is not used, EV fuel economy is 8% lower at 20°F than at 75°F, and driving range is about 12% lower. |
| Hot Weather (Air Conditioning Active) | Under very hot conditions, air conditioning (AC) use can reduce a conventional vehicle's fuel economy by more than 25% (particularly on short trips), and the AC's effect on hybrids, plug-in hybrids, and electric vehicles (EVs) can be even larger on a percentage basis. |
| Rooftop vs. Rear Hitch Cargo Box | Based on ORNL testing (SAE 2014-01-1614) using a 20" H x 40" W x 50" L roof-top cargo box, a large blunt roof-top cargo box can reduce fuel economy by around 2% to 8% in city driving, 6% to 17% on the highway, and 10% to 25% at Interstate speeds (65 mph to 75 mph), whereas rear-mount cargo boxes or trays reduce fuel economy by 1% or 2% in city driving and 1% to 5% on the highway. |
| Added Passenger and Luggage Weight | An extra 100 pounds of cargo weight in a vehicle could reduce fuel economy by about 1%, based on a 0.33% fuel economy improvement per 1% weight reduction estimated by Ricardo Inc. (April 2008) assuming a 3,200 lbs vehicle weight. |
Public Charging Levels, Billing Models, Idle Fees, and Pre-Authorization Holds
Total road trip outlay depends on both the charger level you select and the station operator’s billing rules.
- General public charging uses Level 2 or DC fast charging: Level 1 and 2 stations should typically be located where vehicles are parked for long periods (shopping centers, airports, hotels, government offices, and other businesses), while public charging should also be located along highway corridors or at urban charging hubs.
- Under the Open Charge Point Interface (OCPI) protocol used by the AFDC and Station Locator, a Station Location is a physical place with one or more EV charging ports, an EV Charging Port (charger or EVSE port) provides power to charge only one vehicle at a time even if it has multiple connectors, and a Connector (plug) is what is plugged into a vehicle.
- EV charging times vary based on battery state-of-charge, battery capacity, battery type, the vehicle’s internal charger capacity, and charging equipment power output, ranging from less than 20 minutes using DC fast chargers to 20 hours or more using Level 1 chargers.
- AC Level 1 charging uses a 120 volt (V) AC plug (such as a standard NEMA 5-15 household plug connected to an SAE J1772 connector) and provides approximately 5 miles of range per 1 hour of charging assuming 1.9 kW charging power (8 hours at 120 V replenishes about 40 miles of electric range for a mid-size EV); as of 2023, less than 1% of public U.S. EV charging ports were Level 1.
- AC Level 2 charging operates on 240 V residential or 208 V commercial service at 40 to 80 amperes (with most residential Level 2 chargers operating at up to 30 Amps, delivering 7.2 kW on a 40-Amp circuit under National Electric Code Article 625), ranges from 2.9 to 19.2 kW power output, adds approximately 25 miles of range per 1 hour of charging, and accounted for nearly 80% of public U.S. EV charging ports as of 2023.
- DC fast charging (Level 3) operates at power outputs up to 500 kW, adds approximately 100 to 200+ miles of range per 30 minutes of charging (varying by vehicle and battery state of charge), and accounted for more than 20% of public U.S. EV charging ports as of 2023.
- DC fast charging systems use three connector types—SAE Combined Charging System (CCS, also known as SAE J1772 combo), CHAdeMO, and SAE J3400 (based on Tesla’s NACS design)—and many EVs on the roads today are not capable of charging at rates higher than 200 kW (while Tesla’s limited CCS or CHAdeMO adapter supports charging up to 19.2 kW).
- SAE J3068 (developed in 2018) targets commercial three-phase AC charging at 208/120 V or 480/277 V between 6 kW and 130 kW, while the Megawatt Charging System (MCS, SAE J3271) is under development for DC charging up to 3.75 MW for medium- and heavy-duty vehicles.
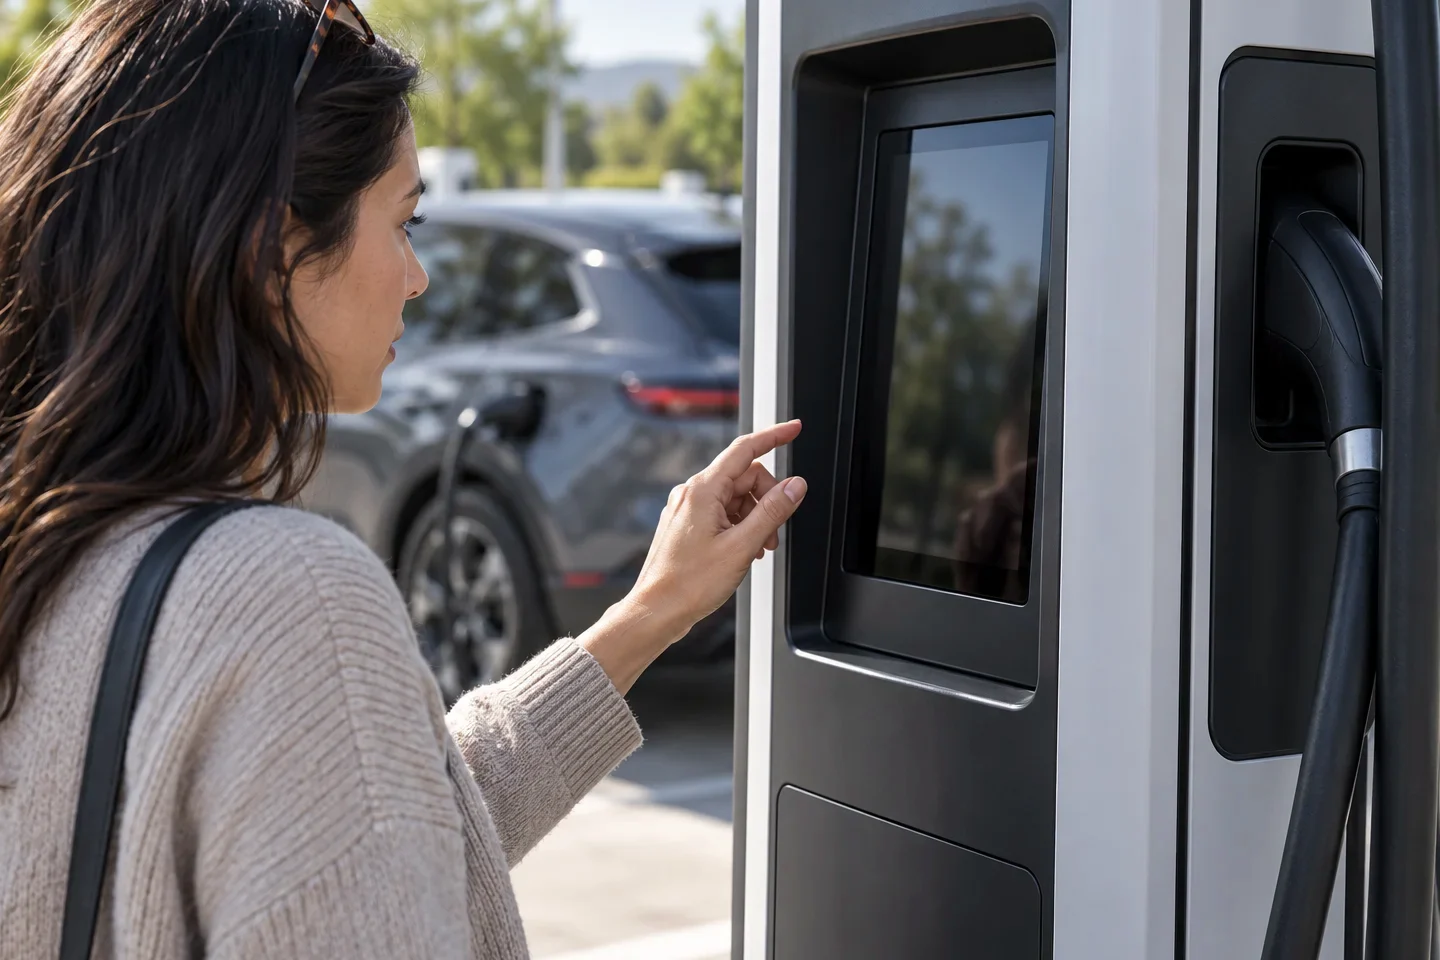
Beyond energy tariffs, drivers must account for utility demand charges passed through by station hosts, membership discounts, idle penalties, temporary card holds, high-SoC charging slowdowns, and highway tolls. For a closer look at walk-up card readers versus app-based payment flows, see our guide to EV charging without an app, and review our explainer on why EV charging slows down as state of charge rises.
- Common public EV charging pricing structures include billing by kWh, by session, by length of time, or through a subscription; session- and time-based structures are common in states where non-utilities are prohibited from selling electricity, and more than 20% of public charging (including Level 1, Level 2, and DC fast chargers) is free to use.
- For charging station owners, utility electricity costs include per kilowatt-hour (kWh) charges, which are typically based on the highest 15-minute average use recorded over a billing period (DC fast charging equipment is more likely to trigger demand charges than Level 1 and Level 2 charging), while average annual maintenance costs are estimated at up to $400 per charger and annual extended warranties for DC fast chargers can cost over $800 per charger per year.
- On Electrify America, DC fast charging pricing is determined by charger location, the driver’s plan, and the amount of energy delivered (with Time-of-Use pricing at select stations offering lower rates during off-peak hours); idle fees may be imposed for parking time after a charging session has ended, and Pass+ members save about 25% on charging via the mobile app.
- Electrify America accepts Visa, Mastercard, American Express, and Discover directly at the charger (and never asks drivers to complete payment by scanning a QR code); for Pass or Pass+ members, all costs for charging, idling, and applicable taxes are charged to the saved payment method at session end with a temporary authorization hold in $20 increments.
- Electrify America places a $50 temporary pre-authorization hold on walk-up credit and debit card sessions to verify the card before dispensing electricity (releasing the difference between $50 and the final charging total after the session ends), whereas account holders with a saved payment method are billed in $20 increments.
- In a case reported by Carscoops, a Chevy Bolt renter paid $418 for a 44-minute charging session at a publicly listed Hyundai dealership charger because the rate was set to $5 per kWh plus another $5 per minute while connected to discourage outsiders, before EVgo refunded $405 to reduce the final cost to $13.27.
- At around 80% state of charge (SoC), EV charging power decreases to avoid exceeding voltage limits so the last 20% during DC fast charging could take almost as long to charge as getting to 80%, while BMW charging guidance notes that a very low (<10%) starting SoC may also reduce maximum charge power.
- TollGuru’s EV Trip Planner combines EV charging station details (brand, connector type, level, cost, power feed, and access time) with toll rates across 37 US states that have toll booths for turnpikes, bridges, or other toll facilities (out of 50 states, while 13 US states and the District of Columbia do not have any toll roads).
EV Charging Stations at Rest Areas vs. Off-Exit Travel Plazas and NEVI Corridors
Drivers searching for ev charging stations at rest areas often wonder why paid DC fast chargers are usually located just off the highway exit at travel centers rather than inside traditional Interstate rest areas. Federal law draws a strict distinction between older service plazas, traditional safety rest areas, and off-highway facilities.
- Under 23 U.S. Code § 111(a), federal-state Interstate System agreements require that the State will not permit automotive service stations or other commercial establishments for serving motor vehicle users to be constructed or located on the rights-of-way of the Interstate System, except for State-owned establishments in existence before January 1, 1960.
- Under 23 CFR § 752.5(b) and (g) governing Safety Rest Areas on the rights-of-way of the Interstate System, the dispensing by any means of petroleum products or motor vehicle replacement parts is not allowed, and no charge to the public may be made for goods and services at safety rest areas except for telephone and articles dispensed by vending machines (with priority given to State licensing agencies under section 2(a)(5) of the Randolph-Sheppard Act, U.S.C. 107(a)(5)).
- Under the Interstate Oasis Program (Pub. L. 109–59, title I, § 1310, Aug. 10, 2005, codified in the notes to 23 U.S. Code § 111), an off-right-of-way facility near the Interstate System may be designated as an interstate oasis if it offers products and services to the public, 24-hour access to restrooms, and parking for automobiles and heavy trucks.
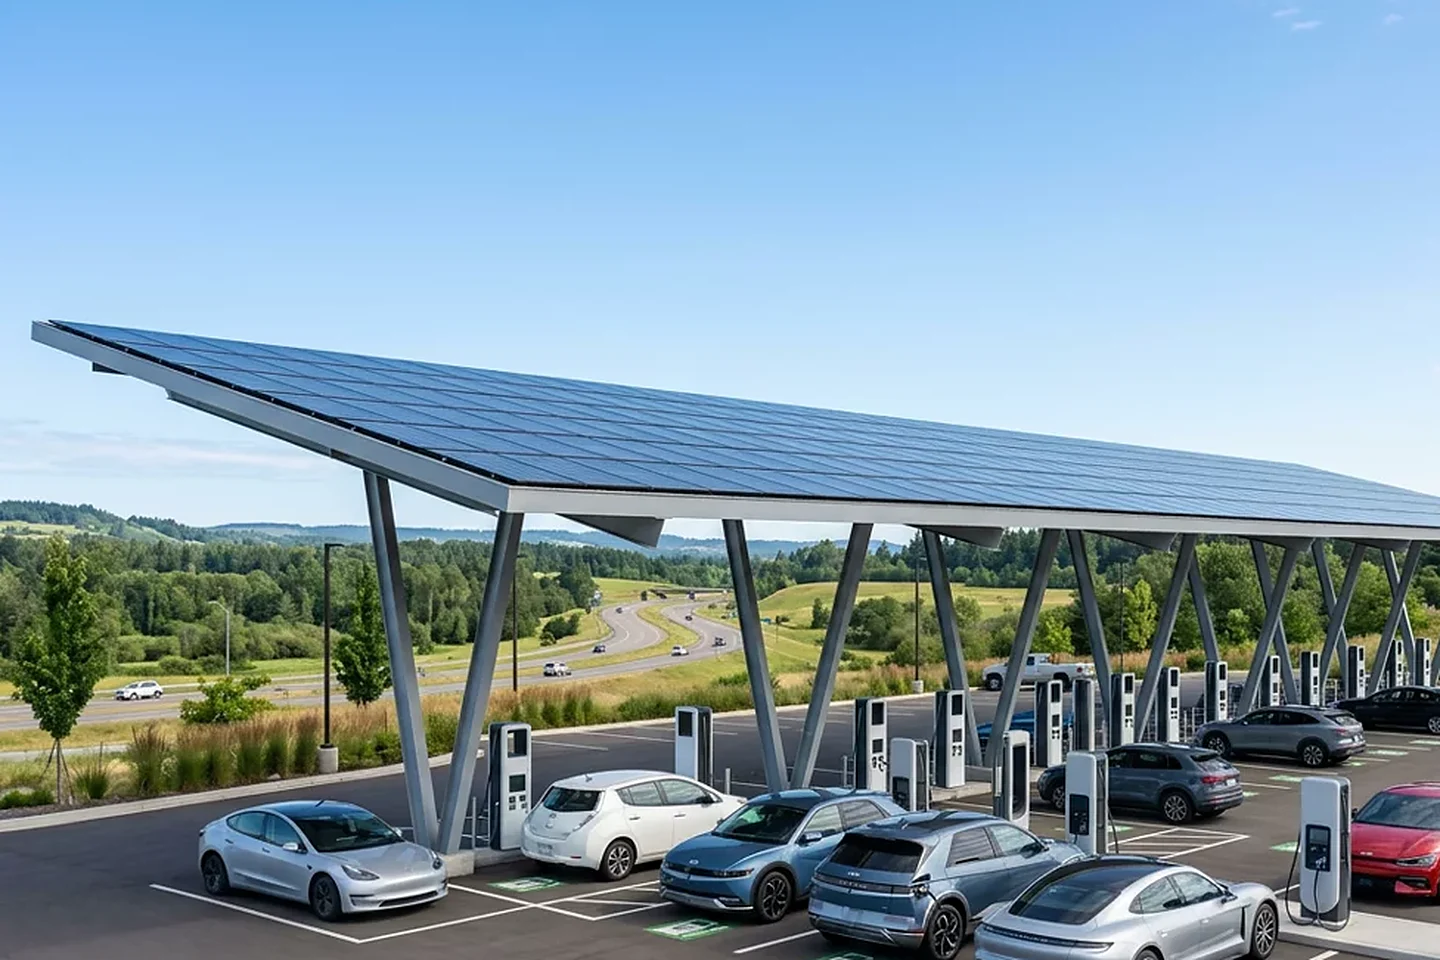
Because of these federal right-of-way rules, private travel plazas and federally funded corridor chargers are built near highway interchanges and governed by technical and pricing transparency rules:
- Under 23 CFR § 680.106(b), NEVI-funded charging stations located along and designed to serve users of designated Alternative Fuel Corridors (AFCs) must have at least four network-connected DCFC charging ports and be capable of simultaneously charging at least four EVs.
- Under 23 CFR § 680.106(c) and (d), each NEVI DCFC charging port must support output voltages between 250 volts DC and 920 volts DC, have at least one permanently attached CCS Type 1 connector (with CHAdeMO connectors permitted using only FY2022 NEVI Funds), and deliver a continuous power rating of at least 150 kilowatt (kW) simultaneously from each port along designated AFCs (while AC Level 2 ports must have a J1772 connector and provide at least 6 kW per port simultaneously).
- Under 23 CFR § 680.106(e), (f), and (i), NEVI corridor charging stations must be accessible to the public 24 hours per day, 7 days per week, year-round, maintained in compliance for not less than 5 years from initial operation, and—unless permanently free—must provide a contactless payment method accepting major debit and credit cards plus an automated toll-free phone number or SMS payment option without requiring a membership or curtailing power flow based on payment method or membership.
- Under 23 CFR § 680.116(a), the price for charging at NEVI-funded stations must be displayed prior to initiating a charging transaction, be based on the price for electricity to charge in $/kWh (satisfied within one year from February 28, 2023), be the real-time price that cannot change during the session, and clearly display and explain the price structure including any other fees in addition to the price for electricity.
- Under 23 CFR § 680.116(b) and (c), each NEVI charging port must have an average annual uptime of greater than 97%—calculated on a monthly basis for the previous twelve months using µ = ((525,600 − (T_outage − T_excluded)) / 525,600) × 100—and make pricing structure, real-time price (in Open Charge Point Interface 2.2.1 terms), payment methods, and trailer pull-through stall accessibility available free of charge via API.
- Illinois’s first federally funded NEVI charging station opened in July 2026 in Casey just off the I-70 interstate at a Phillips 66 fuel retailer—funded by an $854,000 grant in collaboration with Meyer Oil and Electrify America—bringing four DC fast chargers, alongside a $23.5 million funding round for 29 interstate projects (140 ports), each capable of charging a typical EV from empty in under 30 minutes.
- According to Vending Times (January 6, 2026), U.S. EV sales reached 438,487 units (accounting for 10.5% of overall sales) in Q3 2025, an estimated 76,000 charging stations operated in the U.S. by early 2025 (with 64% of U.S. residents living within 2 miles of a station), a FLO survey found 51% of fast-charger drivers on long trips engage with onsite amenities and 60% eat or buy refreshments, and bp acquired TravelCenters of America (TA/Petro) in 2023 to deploy charging across 280 highway travel centers.
Pre-Trip Cost Worksheet Inputs
Before starting a long-distance drive, record three baseline inputs so your cost worksheet reflects real corridor conditions rather than ideal laboratory assumptions:
- Trip Distance: Log the total highway mileage between each planned charging stop, including detours to off-exit travel plazas.
- Vehicle Consumption Unit: Record whether your vehicle displays consumption in kilowatt-hours per hundred miles or distance per kilowatt-hour, and apply weather, speed, and cargo derating before dividing distance by efficiency.
- Station Pricing Structure: Check each planned stop in advance to confirm whether the operator bills by energy, by time, by session, or by subscription, and note any idle fee rules or payment card holds.
For additional route preparation checklists and vehicle ownership guides, browse our road trip and mobility blog archive.
Frequently asked questions
How do you calculate the kWh needed for an EV road trip?
The fuel consumption rate on the EPA electric vehicle label states how many kilowatt-hours (kWh) the vehicle would use to travel 100 miles, a rate of consumption that relates directly to the amount of electricity used and to cost.
Clean Energy Calculator’s EV Road Trip Cost Planner calculates Usable Range = Battery kWh × Efficiency (mi/kWh) × (80% max − 10% min) = Battery × Efficiency × 0.70, First Leg = Battery kWh × Efficiency × (Starting Charge% − 10% minimum), Total kWh = Trip Distance ÷ Efficiency, and Total Cost = Total kWh × Charging Rate ($/kWh), assuming 65 mph highway speed and 30 minutes per DC fast-charge stop to 80%.
EV battery charging efficiency varies, but it is often 84% to 93%, based on published studies (Chae et al., 2011; Gautam et al., 2011) and data from the Idaho National Laboratory Advanced Vehicles website.
Why are paid EV charging stations rare inside traditional Interstate rest areas?
Under 23 U.S. Code § 111(a), federal-state Interstate System agreements require that the State will not permit automotive service stations or other commercial establishments for serving motor vehicle users to be constructed or located on the rights-of-way of the Interstate System, except for State-owned establishments in existence before January 1, 1960.
Under 23 CFR § 752.5(b) and (g) governing Safety Rest Areas on the rights-of-way of the Interstate System, the dispensing by any means of petroleum products or motor vehicle replacement parts is not allowed, and no charge to the public may be made for goods and services at safety rest areas except for telephone and articles dispensed by vending machines (with priority given to State licensing agencies under section 2(a)(5) of the Randolph-Sheppard Act, U.S.C. 107(a)(5)).
Under the Interstate Oasis Program (Pub. L. 109–59, title I, § 1310, Aug. 10, 2005, codified in the notes to 23 U.S. Code § 111), an off-right-of-way facility near the Interstate System may be designated as an interstate oasis if it offers products and services to the public, 24-hour access to restrooms, and parking for automobiles and heavy trucks.
How do idle fees and credit card holds affect EV road trip charging costs?
On Electrify America, DC fast charging pricing is determined by charger location, the driver’s plan, and the amount of energy delivered (with Time-of-Use pricing at select stations offering lower rates during off-peak hours); idle fees may be imposed for parking time after a charging session has ended, and Pass+ members save about 25% on charging via the mobile app.
Electrify America places a $50 temporary pre-authorization hold on walk-up credit and debit card sessions to verify the card before dispensing electricity (releasing the difference between $50 and the final charging total after the session ends), whereas account holders with a saved payment method are billed in $20 increments.
In a case reported by Carscoops, a Chevy Bolt renter paid $418 for a 44-minute charging session at a publicly listed Hyundai dealership charger because the rate was set to $5 per kWh plus another $5 per minute while connected to discourage outsiders, before EVgo refunded $405 to reduce the final cost to $13.27.
How much do cold temperatures and rooftop cargo boxes reduce EV highway range?
For electric vehicles (EVs) at 20°F, fuel economy can drop roughly 39% in mixed city and highway driving and driving range can drop by 41%, with about two-thirds of the extra energy consumed used to heat the cabin.
Based on a 2019 study by AAA, when the cabin heater is not used, EV fuel economy is 8% lower at 20°F than at 75°F, and driving range is about 12% lower.
Based on ORNL testing (SAE 2014-01-1614) using a 20“ H x 40“ W x 50“ L roof-top cargo box, a large blunt roof-top cargo box can reduce fuel economy by around 2% to 8% in city driving, 6% to 17% on the highway, and 10% to 25% at Interstate speeds (65 mph to 75 mph), whereas rear-mount cargo boxes or trays reduce fuel economy by 1% or 2% in city driving and 1% to 5% on the highway.
Sources
- U.S. Department of Energy and U.S. Environmental Protection Agency — FuelEconomy.gov Electric Vehicle Label and Cold/Hot Weather Guides
- U.S. Department of Energy — Alternative Fuels Data Center Electric Vehicle Charging Infrastructure Guidance
- Oak Ridge National Laboratory — Electric Vehicle Efficiency and Cargo Aerodynamic Drag Studies
- Electrify America — Public Fast Charging Pricing Plans, Idle Fees, and Payment Authorization Documentation
- Carscoops — Public Charger Per-Minute Compound Billing Case Report
- United States Code — Federal-Aid Highways Interstate System Rights-of-Way and Oasis Program Provisions
- Federal Highway Administration — Safety Rest Area and National Electric Vehicle Infrastructure Regulations
- ElectricDrives — Illinois Interstate Corridor Fast-Charging Station Deployment Report
- Vending Times — Highway Fast-Charging Driver Amenity Survey and Travel Center Deployment Report
- Clean Energy Calculator and TollGuru — Electric Vehicle Road Trip and Toll Route Planning Tools